It’s no secret we’re big fans of our Clariti users. We love catching up with them and getting a behind-the-scenes peek into how they organize and optimize their blog content — and use the data from Clariti to make clear decisions about their site. We thought you might be interested too, so we are sharing their stories right here on the blog.
Everyone… meet Laura and Sarah!
Hi Laura and Sarah! Please tell us about the site you have on Clariti. Do you have a specific niche?
We run a food blog called Wandercooks, which provides edible adventures for the curious foodie. We have over 365 blog posts on our website site that we manage and track with Clariti. In addition to our food blog, we also educate food bloggers about keyword research and Google Analytics. We even have an ebook course for food bloggers about how to use Google Analytics 4 (GA4).
What were you using to track your blog content data before Clariti?
Before using Clariti, we were reviewing our blog post analytics using a combination of Google Search Console (GSC), GA4, and one master Excel spreadsheet. In order to review one post’s performance, we had to switch between multiple open browser tabs, searching for the information we needed.
We also used a tool called KeySearch to track our keywords, but it has a limit of 80 keywords (unless you want to invest in the enterprise plan).
Why did you decide to sign up for Clariti?
We first learned about Clariti on the Food Blogger Pro Podcast, and decided to do more research after one of our food blogger friends signed up.
We were getting sick of jumping between our master Excel spreadsheet and multiple browser tabs to check our post analytics. This process was taking well over an hour each week, plus the updates with GA4 were making it difficult to pull the data we needed.
A lot of food bloggers complain about how difficult GA4 is to learn and use. We actually teach bloggers how to use Google Analytics as a part of our business, but we feel the same way! It easily takes 10-15 more clicks to get the same information in GA4 whereas Clariti provides it much more seamlessly.
After realizing that Clariti could help us stop relying so heavily on Excel and spending so much time in GA4, we decided to test it out. Now we have access to all our analytics in one place, and it’s made a huge impact on our workflow!
How did you learn how to use Clariti?
We started by exploring the ‘helpful tips’ section on Clariti’s blog, and that gave us some great ideas on the types of projects we could create in Clariti.
Once we imported our data, we started testing out some of the features and comparing them to the features we use inside GSC and GA4.
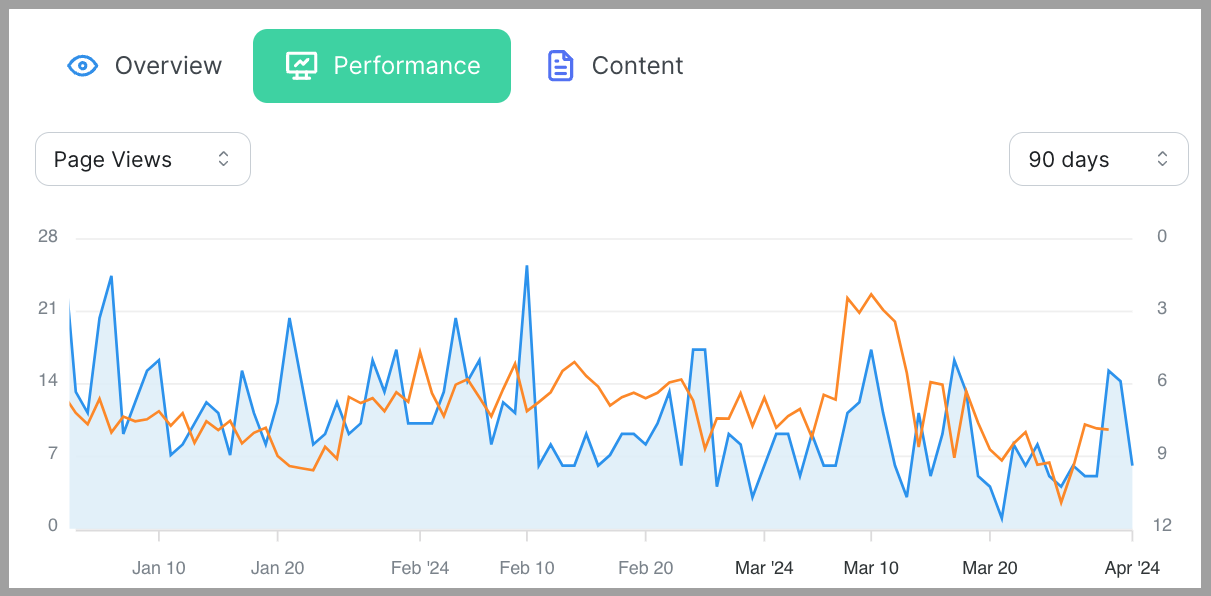
Our first mind-blowing moment with Clariti came when we started playing with the graph overlay feature inside the post performance tab. We loved that it allowed us to visually track our page views (blue line) and target keywords (orange line) alongside each other; something we couldn’t easily do with GSC or GA4.
That feature made everything worth it to us!
As we learned more about Clariti’s capabilities, we emailed our questions to the Clariti support team. They were super responsive and helpful as we imported all our data.
We think Clairit is a great option for food bloggers who want an easy way to monitor their post’s performance and health, without getting lost in the weeds of a more complicated software.
You don’t have to be tech savvy in order to use it.
Clariti is very intuitive, and much more user friendly than bigger, industrial looking systems.
What features of Clariti are your favorite?
The Performance Graph
Our favorite feature by far is the graph overlay feature inside the Performance tab. We click on the data for the keyword we’re trying to rank for and overlay it on the post’s page views. This allows us to visually analyze each keyword’s performance over time. It’s so convenient to see all the data on one graph.
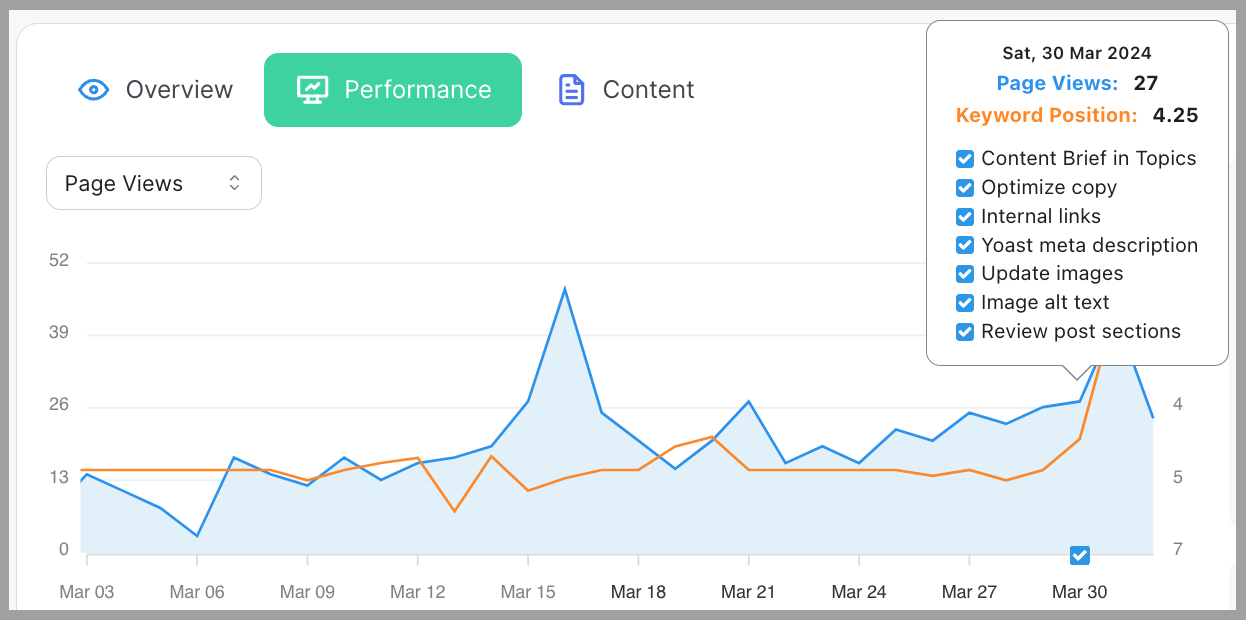
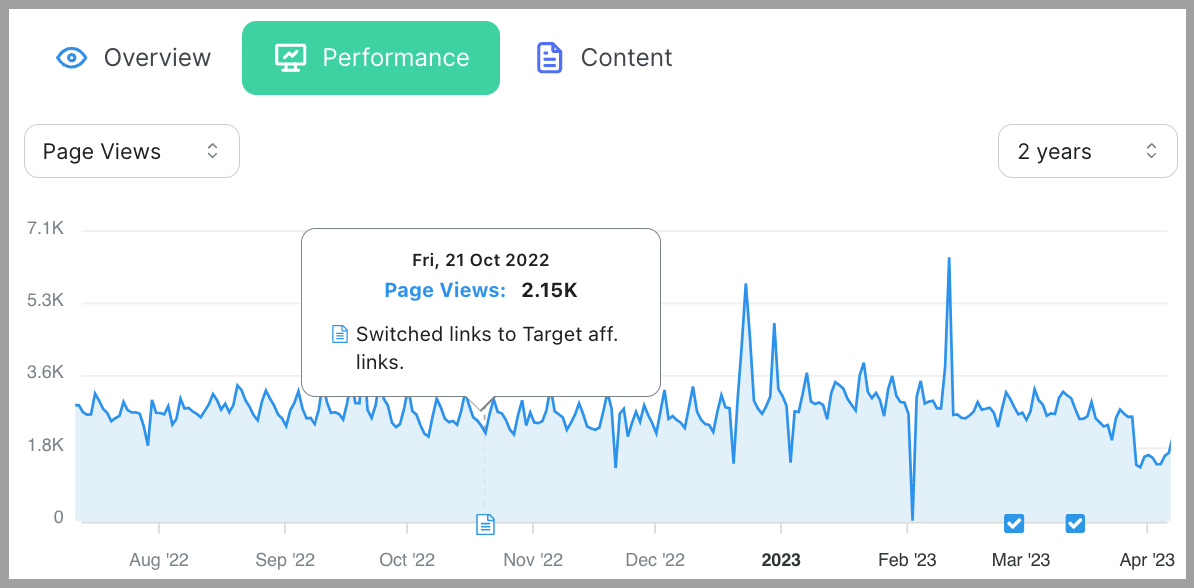
We also love that this feature allows us to leave annotations directly on the graph* whenever we update a post. This feature was taken away from GA4, and as visual people, this feature makes tracking updates so much easier, so we actually know what’s working!
*Bonus points for Clariti: you can manually add your own annotations to the graphs OR let the to-do list feature inside Clariti automatically add them for you as you check things off! Pure data magic!
The Explore Page
We love Clariti’s Explore page for the simple fact that we can set it up so it displays our posts according to the publish date, instead of the number of page views. Google Analytics does it all by page views, which meant we were wasting a lot of time searching for the specific posts we wanted to analyze each week.
The Explore page makes it easy to actively monitor new posts’ performance by giving a quick, high level snapshot of things like page views, positioning, traffic sources, and top keywords, all on one page.
Clariti even gives us instant feedback on issues like missing alt tags and inbound links, and broken links.
Without these features, we’d probably miss out on opportunities to continue optimizing and improving our blog posts over time.
For this reason, the Explore page has become our one stop shop for keeping up to date with how each post is performing.
Labels
We love using the labels feature in conjunction with the filtering feature. This makes it super easy to pull data on a specific category of posts like Christmas or Easter. Some other labels we’ve created include ‘New post,’ ‘Recipes to update’ and ‘Reshoot required.’
We’ve also transferred the color-coding system we used in our Excel spreadsheet over to Clariti to make things even easier to organize.
- Posts with over 3,000 page views a month are labeled gold
- Posts with over 1,000 page views a month are labeled green
- Posts with under 1,000 page views a month are labeled white
- Seasonal posts are labeled purple
For Mac users, it’s very similar to color-coding different Mac folders, which we love!
How has Clariti changed the way you track your blog content data?
Clariti provides a better overview of how each post is performing over time compared to GA4, so we can quickly identify the best ways to optimize each post moving forward.
Clariti’s features have even helped us recognize new trends reflected in our posts we may not have noticed before using Clairiti.
For example, with recent search engine updates, we’ve noticed a drop in some of our site traffic, even though Clariti shows that our target keyword positioning hasn’t changed. Before using Clariti, our knee-jerk reaction would have been to target different keywords and start editing blog posts to encourage more page views.
Because of the insight Clariti provided, we were able to see that the posts were ranking in the same position since the October 2023 Core Update, so targeting different keywords was not the right decision. This allowed us to explore alternative solutions, like monitoring site traffic outside of Google.
Ultimately, what does Clariti provide for you now that you didn’t have before?
With GA4 becoming increasingly difficult to use, Clairiti has been a game changer for streamlining our data analytics and blog post performance process. We no longer have to open multiple web browsers, click to additional pages, or struggle with GA4 load times to find the information we need.
Honestly, I don’t remember the last time we were in GA4 for our weekly review.
Clariti has helped us simplify our workflow and saves us SO MUCH time by easily accessing our blog performance data in one place.
Would you recommend Clariti to a fellow content creator?
Clariti is the ultimate tool for bloggers who want to simplify their analytics, streamline their keyword research, and manage all their content projects in one place.
The name “Clariti” truly says it all.
It’s brought so much clarity to how we track our data, and update our posts. It gives you all the information you need in ONE place, instead of having to go out and find it yourself.
If you’re someone who struggles with things like tech and data analytics, Clariti is all you need.
As Laura puts it…”It’s like having a blogging butler!”
About the Author
Owner of Duett, Allea Grummert is a marketing strategist, conversion copywriter and email automation expert. She helps bloggers and content creators make a lasting first impression through automated welcome & nurture sequences that engage readers, build brand loyalty and optimize conversions for sales and site traffic.