Clariti now lets you add an annotation once and see it across every performance chart on your site. We’ve also added official Google core updates automatically, so you can connect traffic changes to what was happening at the time without digging through old notes or searching for rollout dates.
If you’ve ever looked at a spike or dip and wondered, “What happened here?” this feature is for you. Maybe you changed themes, switched ad networks, moved to a new host, or sent a newsletter that took off. The chart shows you when traffic changed; annotations help you remember why.
Annotations have been available on individual post charts for a while. Now you can also mark events that affected your entire site and see Google core updates alongside them.
Mark It Once, See It Across Your Site
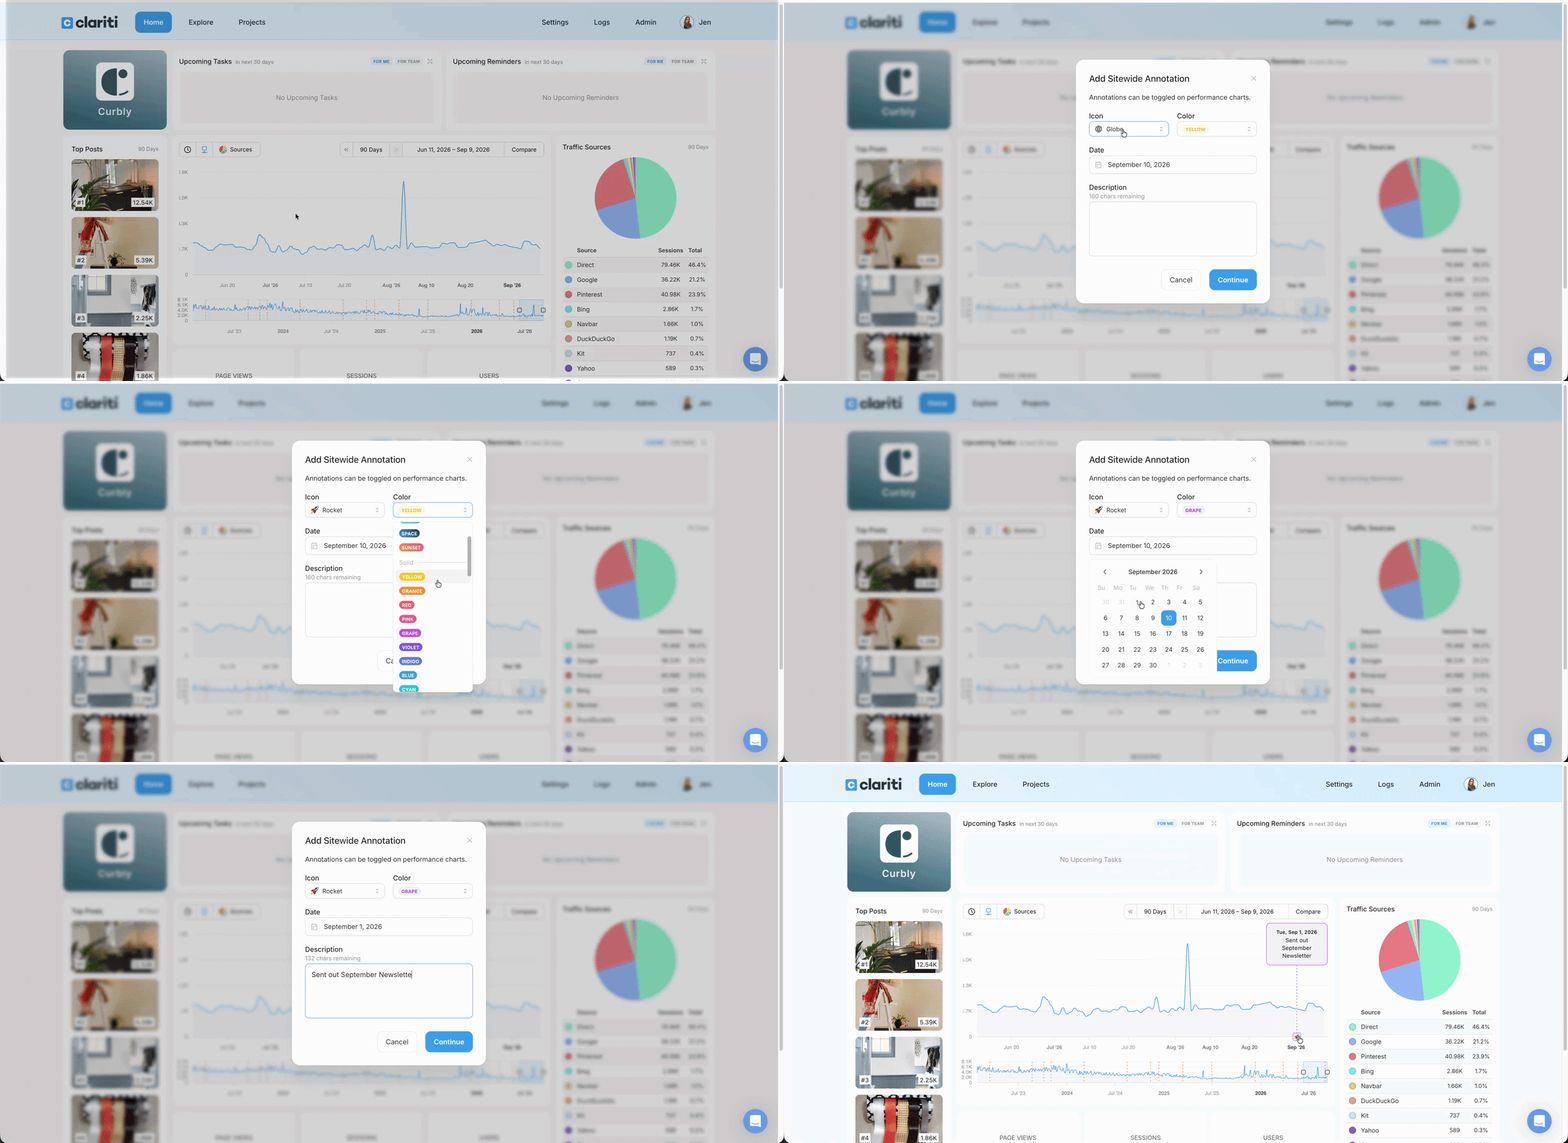
You can add a sitewide annotation in three ways:
- From a chart. Click any date on your Home dashboard or a post’s Performance tab, then select Add Annotation from the tooltip.
- From the annotations menu. Click the annotations icon above the chart, next to the Sources selector, and choose Add Annotation.
- From Quick Actions. Open any post, click Quick Actions, and choose Add Annotation. You can also press Option + E.
Choose an icon and color, select the date, and add a short description of what happened. Once saved, the annotation appears as a flag with a dashed line on that date. Hover over the flag to read the description, or click it to edit or remove the annotation.
See Google Core Updates Without Looking Them Up
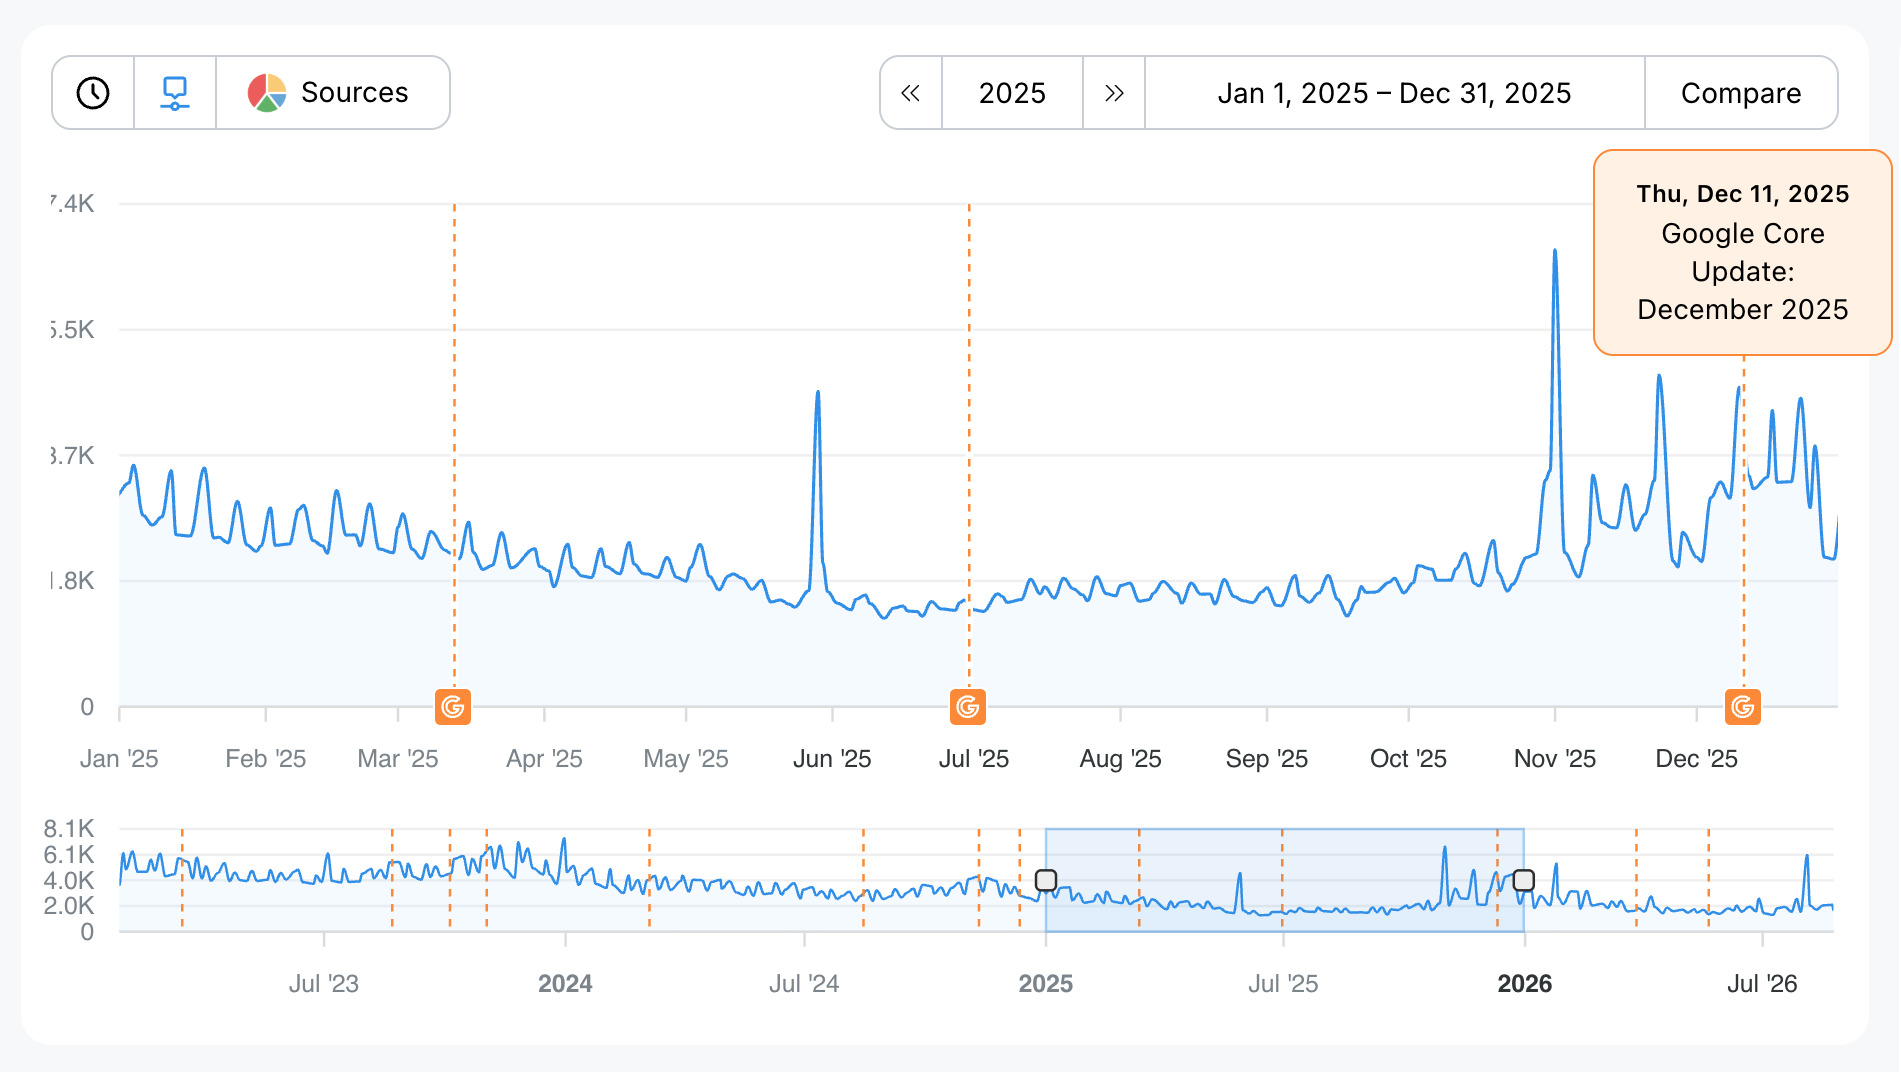
Official Google core updates now appear automatically on every performance chart in Clariti. They’re marked with an orange flag and the Google icon, with no setup required.
When traffic shifts, you can quickly see whether a Google update rolled out around the same time. That gives you useful context before you start investigating your own changes.
Make Annotations Easy to Recognize
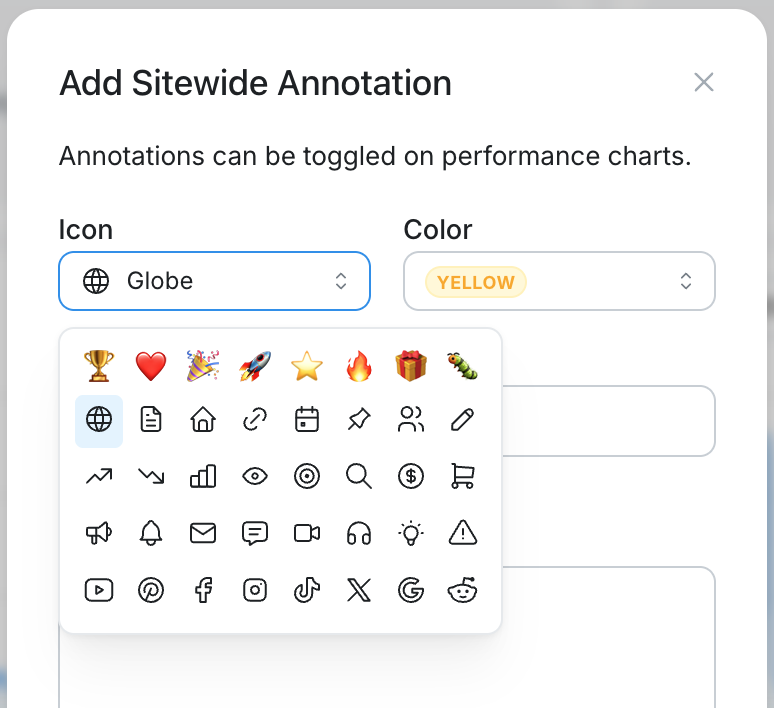
Give each annotation a color and icon so you can tell at a glance what kind of event it represents.
Choose from the same colors available for labels, including the Aurora, Berry, Ocean, Space, and Sunset gradients. Icons cover common events such as a redesign, launch, or promotion, along with YouTube, Pinterest, Facebook, Instagram, TikTok, X, Google, and Reddit. You can also choose an emoji 🔥
Choose Which Annotations You See
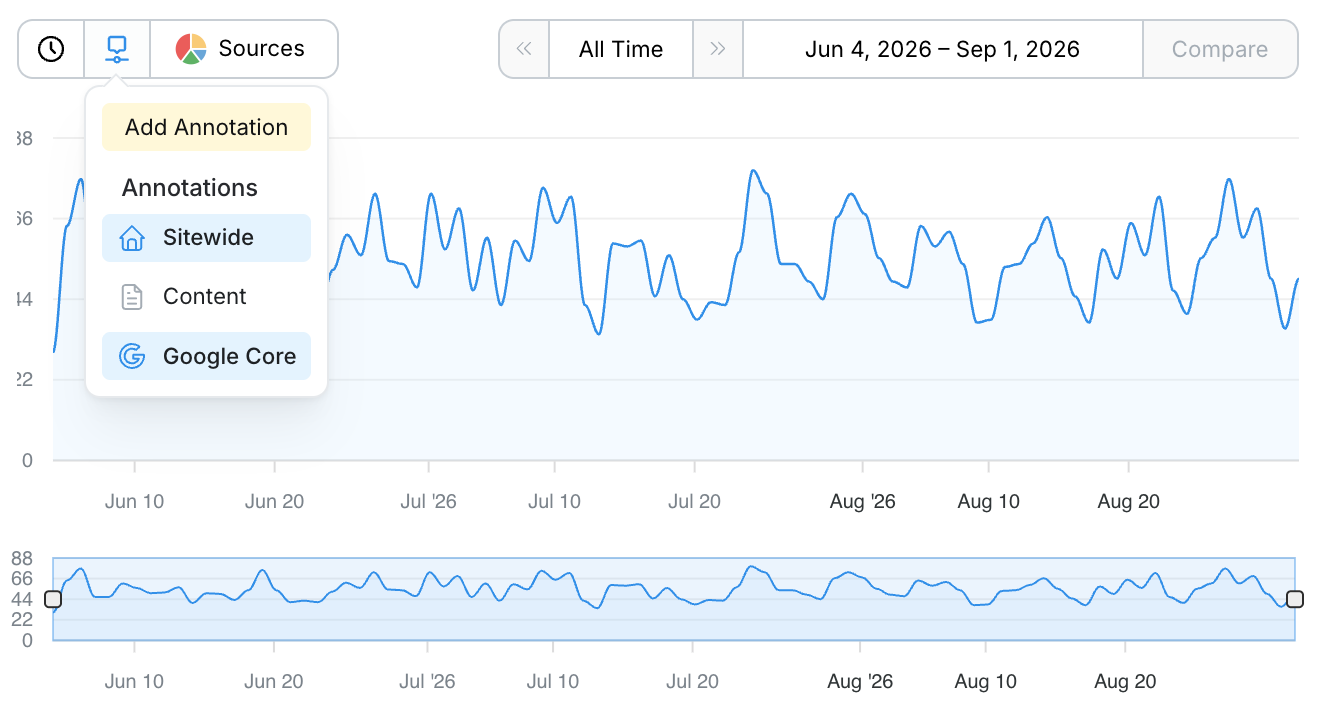
Use the annotations menu above any chart to show or hide each annotation type. On your Home dashboard, you’ll see Sitewide and Google Core. On a post’s Performance tab, you’ll also see Content for annotations tied only to that post.
The first time you open a post’s performance chart, it will use the selections from your Home dashboard. After that, Clariti remembers your choices for that chart.
Ways to Put Annotations to Work
- Keep a record of major site changes. Mark theme updates, host migrations, plugin changes, and ad network switches so you can find the exact dates later.
- Add context before analyzing a traffic drop. Check for a nearby Google core update before assuming a change you made caused the decline.
- Track the impact of promotions. Mark a newsletter send, Pinterest push, or roundup feature, then see how traffic responded.
- Build a history of your site. Over time, your performance chart becomes a visual record of the changes you made and what happened next.
Available Now
Sitewide annotations and Google core updates are available to all Clariti subscribers. Head to your Home dashboard to turn on Google Core updates and add your first sitewide annotation.
Let us know what you discover. We love hearing how you’re using Clariti to make smarter content decisions.

About the Author
Jen is the Associate General Manager at Clariti with a soft spot for great tech and good snacks. She has a Master’s degree in Human-Computer Interaction (which is a fancy way of saying she’s really into how people and tech get along). When she’s not working, you can usually find her hanging out with her family or baking something she’ll insist is “just a little treat.”