
Have you ever noticed an ‘average position’ of 1 in Google Search Console or Clariti, yet your post gets little to no traffic? It’s a common SEO puzzle that can lead to misleading insights. In this post, we’ll break down why these metrics can sometimes be misleading and how to decide if your post needs an update.
Why Keywords Matter for Your Content Strategy
Keywords are the bridge between your audience’s questions and the solutions your site provides. By focusing on the right keywords, you can:
- Reach the right readers: Connect with people actively searching for content like yours.
- Boost your visibility: Increase your chances of showing up in search results, driving more organic traffic.
- Build authority: Consistently publishing content around related topics helps you establish expertise in your niche.
But simply sprinkling a keyword into your post isn’t enough. You also need to track how your content performs for that keyword—using metrics like Impressions, CTR (Click-Through Rate), and Average Position—to ensure you’re serving search intent effectively. That’s where Clariti comes in, giving you a clear view of your SEO performance straight from Google Search Console (GSC).
The Three Key Metrics
Within Clariti, we pull three essential metrics from GSC for each post and keyword:
- Impressions: The number of times Google displayed your page for a specific keyword.
- CTR (Click-Through Rate): The percentage of those impressions that turned into actual clicks.
- Average Position: The average ranking position of your page when it appears in search results.
Understanding how these metrics interact is crucial. For example, a high average position might look impressive—but if your impressions and CTR are low, it’s a sign that your content isn’t reaching most searchers.
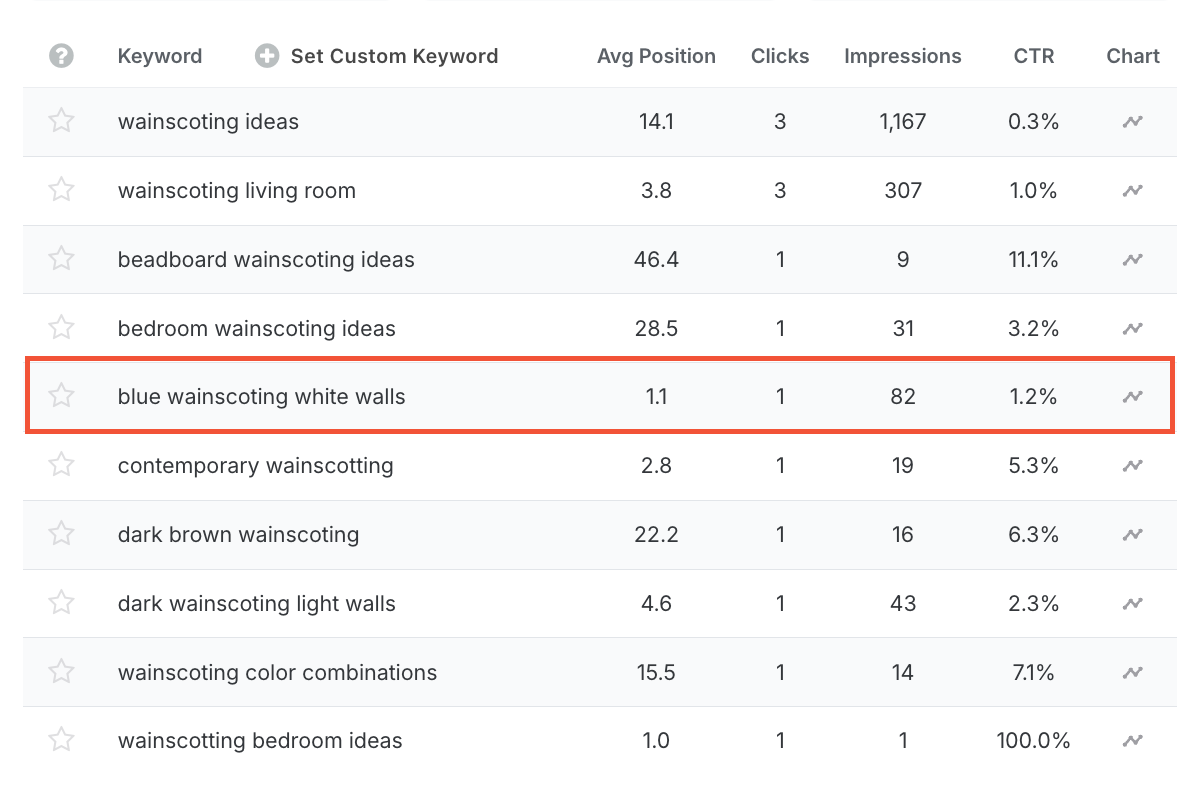
How Average Position Can Be Misleading
Google’s “average position” is just that—an average across all searches where your page appeared. Your page might rank #1 for one reader due to personalization or location, yet rarely shows up for everyone else. That single data point can skew the average, creating the illusion of high performance.
Example Scenario: Location-Based Personalization
Suppose you run a food blog and have an article targeting the keyword “best pizza restaurants.” In GSC, you notice the following:
- Average Position: #1
- Impressions (last year): 18
- CTR: 2.9%
When you dig deeper, you see that the position fluctuates based on location:
- New York Reader: Your page consistently ranks in positions 1-2 because it features several top New York pizza spots.
- Los Angeles Reader: Your page ranks in positions 5-6 since the content isn’t as relevant to their local search needs.
This variance is due to Google’s personalized search algorithm, which often prioritizes location-specific results even for general keywords.
Example Scenario: Search History Personalization
Another common case is when returning visitors who’ve visited your site before seeing your page ranked higher due to Google’s personalized search history preferences.
- New vs. Returning Visitors:
- Returning visitors may see your content in positions 1-2.
- New visitors might see it in positions 4-5 because Google hasn’t yet associated your site as highly relevant for them.
These nuances help explain why a “high average position” in Clariti or GSC can sometimes be misleading when impressions and CTR remain low.
💡 Pro Tip: A high average position doesn’t always mean high visibility. Check for location and personalization influences to get the real picture of your page’s reach.
How to Analyze Your Keyword Performance
1. Evaluate Keyword Position with Impressions
A keyword worth targeting typically has a decent monthly search volume. Impressions tell you how often Google shows your post in results.
- Check trends: Look at impressions over 3–6 months. Are they increasing, flat, or dropping?
- Spot the red flags: Single- or double-digit impressions over a long period suggest that the high average position might be an anomaly.
2. Evaluate Click-Through Rate (CTR)
CTR measures how compelling your content appears to readers:
- For top-ranked posts (positions 1–3): Expect a higher CTR (often 10% or more).
- Low CTR on high positions: This could indicate that your title or meta description isn’t resonating or that you’re not ranking as prominently as the average position suggests.
- Different scenarios:
- A high position with low CTR signals a disconnect in messaging.
- A lower ranking (e.g., positions 7–10) with a decent CTR may indicate untapped potential—moving up could yield even more clicks.
3. Decide Whether to Update Your Post
A keyword ranking well in GSC or Clariti doesn’t always mean it’s worth keeping. If it’s not driving traffic, it may be time for a refresh. Here’s how to determine if it’s time for an update:
- High Position, Low Impressions:
If your average position looks great but impressions remain minimal, you’re likely not reaching the broader audience. A refresh or optimization might be necessary. - Moderate Impressions, Very Low CTR:
Consistent visibility paired with low clicks suggests your snippet isn’t compelling. Consider revising your title and meta description. - Keyword Potential:
If the keyword has solid search volume and aligns with your brand, it’s worth capitalizing on. Use top keyword research tools to identify the best opportunities and optimize your content to capture that traffic effectively.
4. Using Clariti to Track and Organize Your Updates
Clariti helps you monitor keyword performance and streamline content updates:
- Track Focus Keywords Over Time: Clicking the star icon next to a keyword in Clariti allows you to monitor its average position and performance. If the keyword you want to track isn’t automatically detected, you can manually set a custom Focus Keyword.

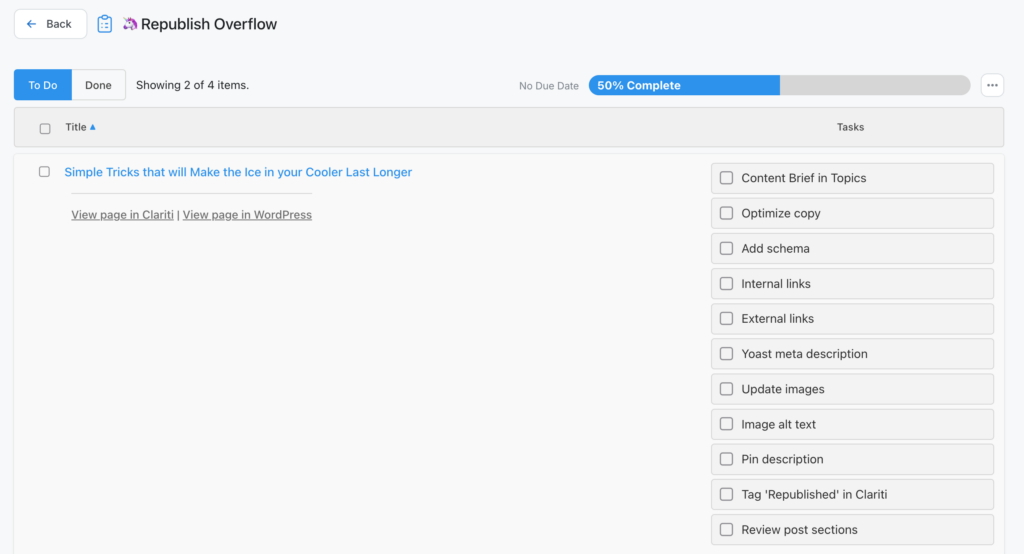
- Create a Project for Content Updates: Set up a “Posts to Update” project and add specific tasks like “improve readability,” “add more details,” or “update images” to keep your workflow organized.
- Monitor Progress with Labels: After updating a post, apply a “Republished” label to filter and track performance changes over time.
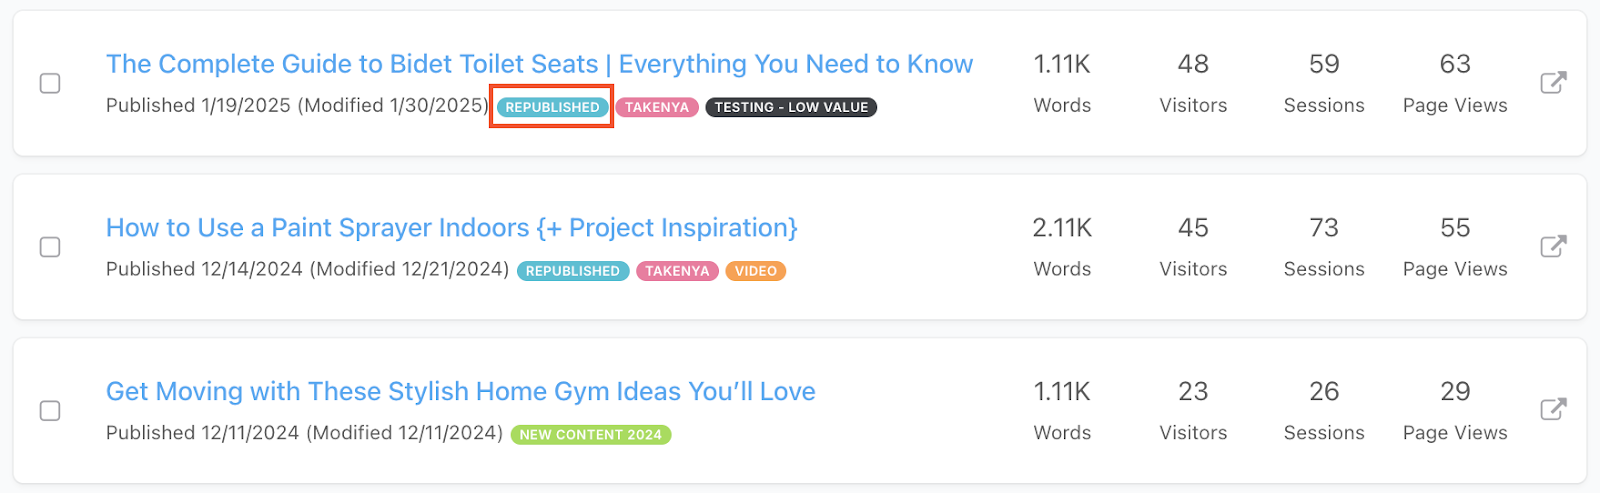
- For more ideas, check out How Curbly Uses Clariti Labels to Stay Organized.
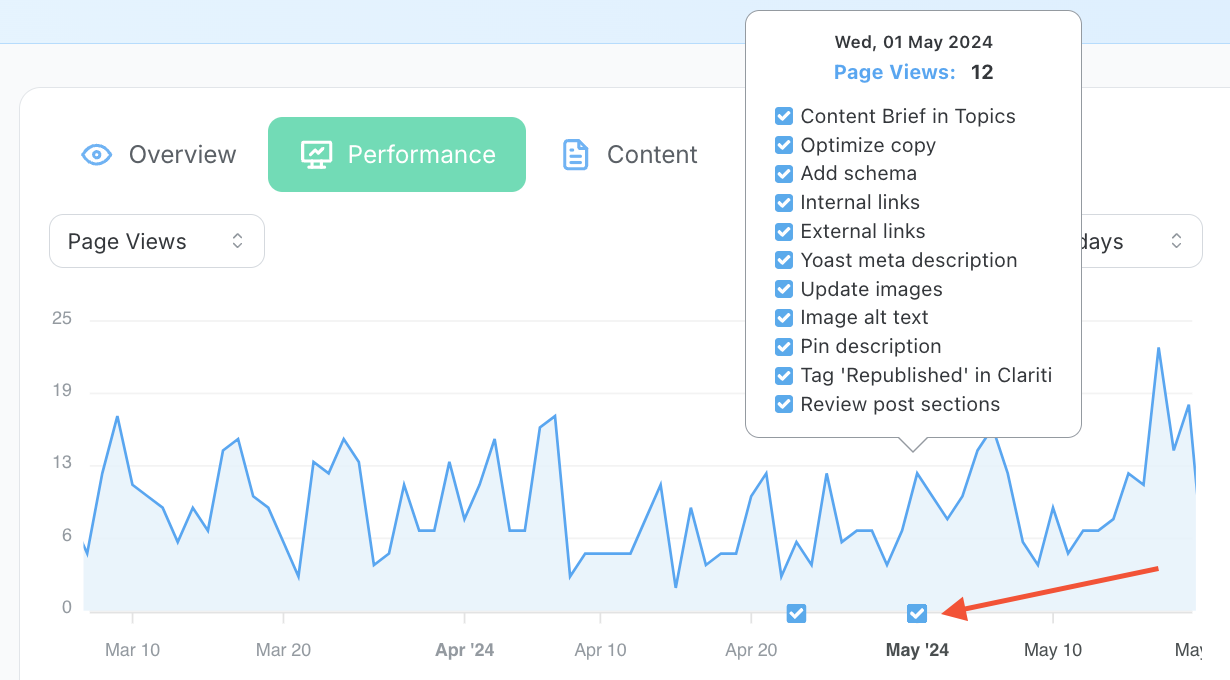
💡 Pro Tip: Each time you check off a task in your project, Clariti adds an annotation on the Performance graph. This helps you visualize the impact of your changes over time.
Key Takeaways
- Metrics Matter: Always cross-check Impressions, CTR, and Average Position to get the full picture.
- Beware of Misleading Averages: A high average position with low impressions usually indicates that your content isn’t consistently ranking well.
- Use Data to Guide Updates: Optimize your posts when the data suggests you’re missing out on valuable traffic.
About the Author
Mary is a customer success and content specialist, dedicated to helping bloggers set up and navigate Clariti with ease. Based in New Mexico, she enjoys hiking mountain trails with her pup, tending to her vegetable garden, and creating art.