Clariti is the content organization system built just for bloggers. Our goal is to help you understand what optimizations you need to make with your content, track the work, and see the results over time.
Thanks to feedback from our early adopter group, we’ve added some new features to Clariti — and I’m excited to share them with you, so you know what’s happening behind the scenes as we develop Clariti to be as helpful as possible for bloggers and content creators like you!
Post-Level Google Analytics Graphs
We want to help you make data-driven decisions on your content.
However, we know how hard it is to see post-level numbers in Google Analytics. We’ve been hard at work setting the stage to provide you with post-level graphs so that you can see trends on each individual post.
With our latest Clariti update, you can now view the performance of a post over time. You can even zoom in and out to get the level of granularity you want.
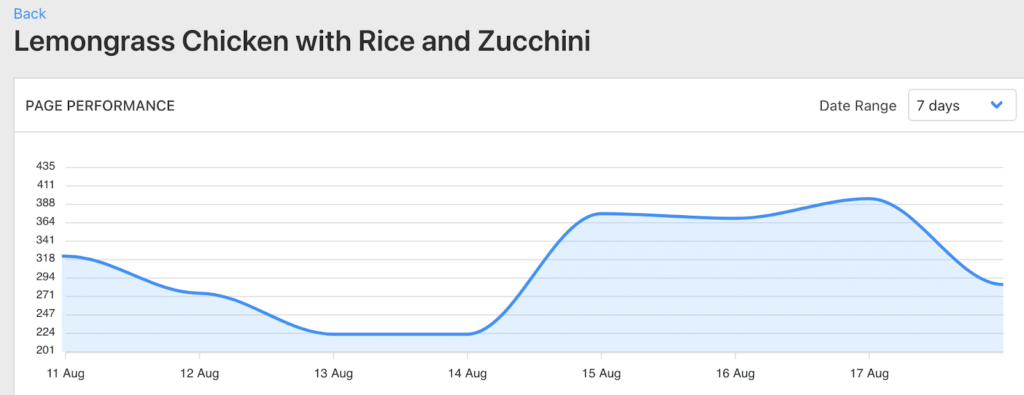
Soon, you’ll start seeing your tasks and notes annotated on this single graph!

This is just the beginning of what’s possible. There’s so much more to come, and we’re so grateful you’re along for the ride!
Period-over-Period Analytics
We’ve been slowly rolling out more and more data to help you know where to make the right decisions when updating your content.
In this release, we’ve added another dimension to our hero metrics on the page details. Now you’ll see how your post is performing period-over-period on major measures so that you can track trends and determine what actions to take on each post.
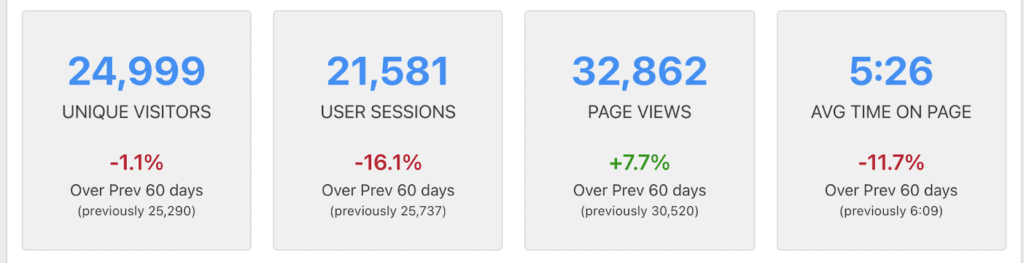
Simply switch the date range using the dropdown above it and you can see how your posts are performing over 7 days, 14 days, 30 days or up to a full year.
‘Campaigns’ is now ‘Projects’
The word ‘Campaign’ can mean a lot of different things in the content and social media world.
We’ve really appreciated your feedback about this small (but often confusing!) word…
So without further ado —moving forward— ‘Campaigns’ shall now be called ‘Projects.’

Want to see it all in action?
Watch the August 2021 demo of Clariti to see how to best use the new features.
About the Author
Ben is a father of 2 boys, a husband, a musician, a woodworker, and a product guy. Ben has spent nearly 15 years building software products from mobile apps, games, to web apps. He has a Bachelor of Science in Writing & Rhetoric from the University of Utah, an MBA from Arizona State University, and a Master of Science in Business Analytics.