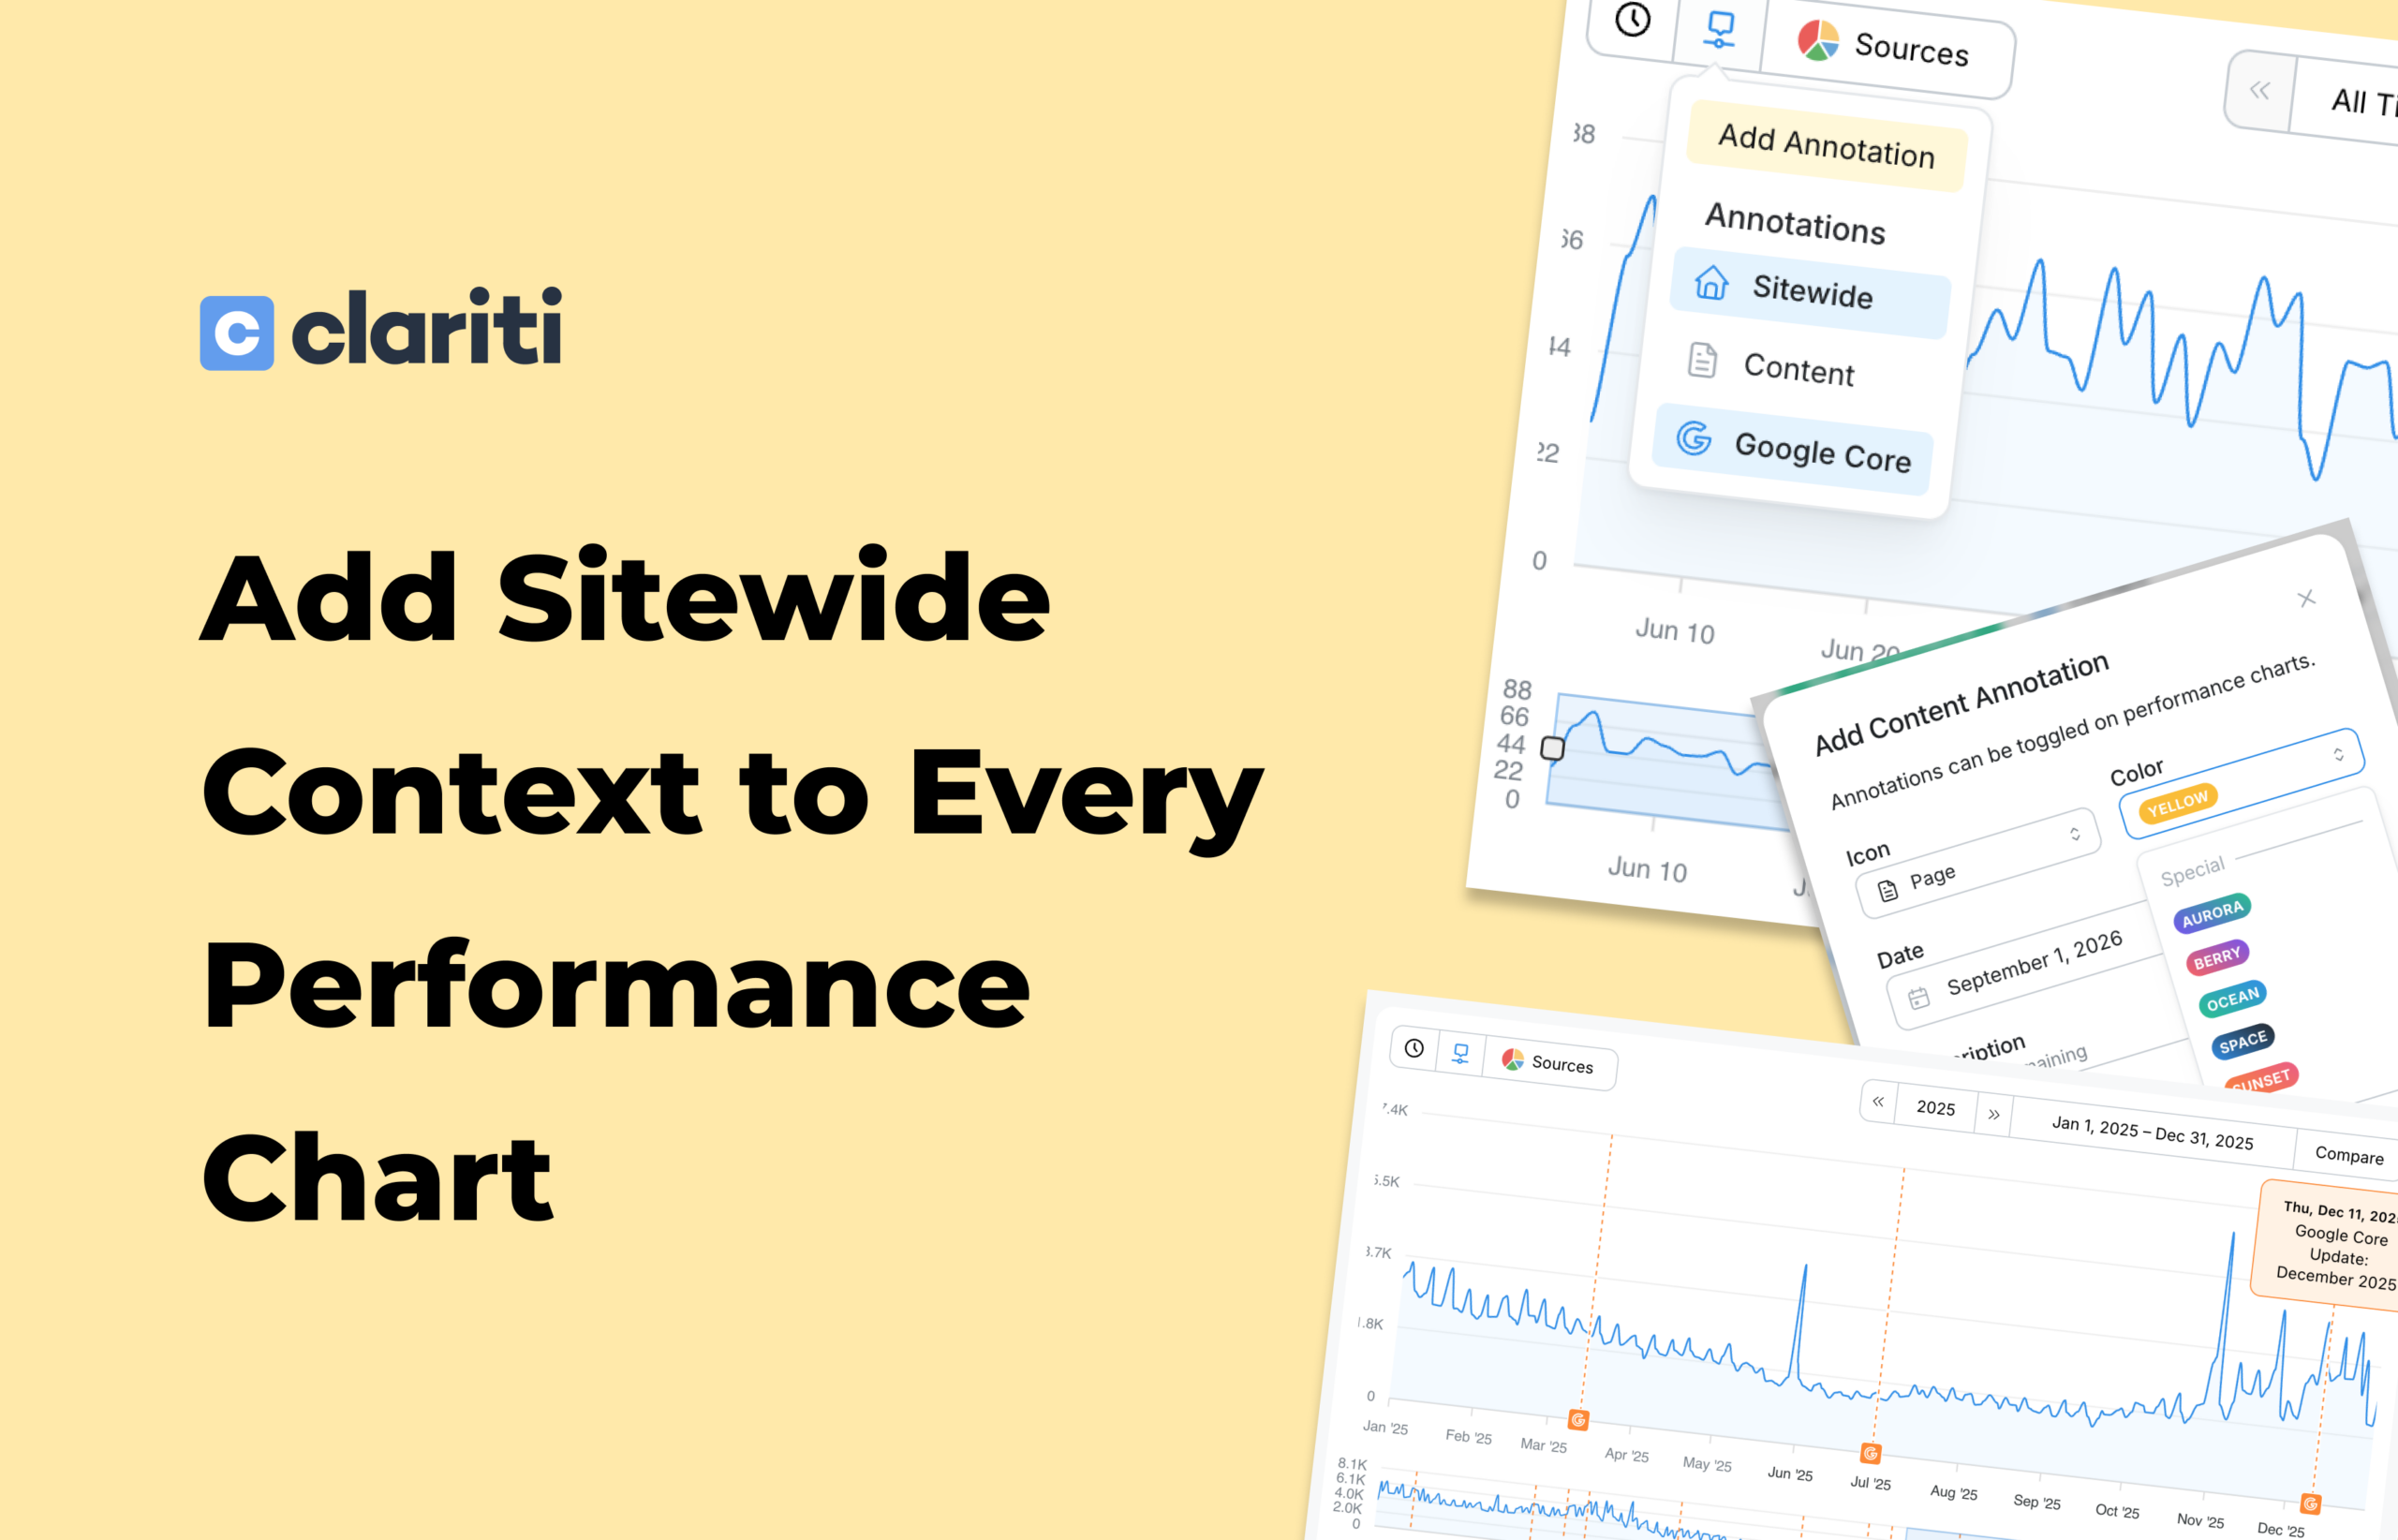
Add an annotation once and see it across every performance chart on your site. Official Google core updates are already marked for you, so the context behind a spike or dip is always close at hand.
Your chart tells you when traffic changed. Clariti annotations help you remember what was happening at the time, whether it was a redesign, an ad network switch, a promotion, or a Google update. You won’t need to search through old notes or rollout dates.
Mark It Once, See It Across Your Site
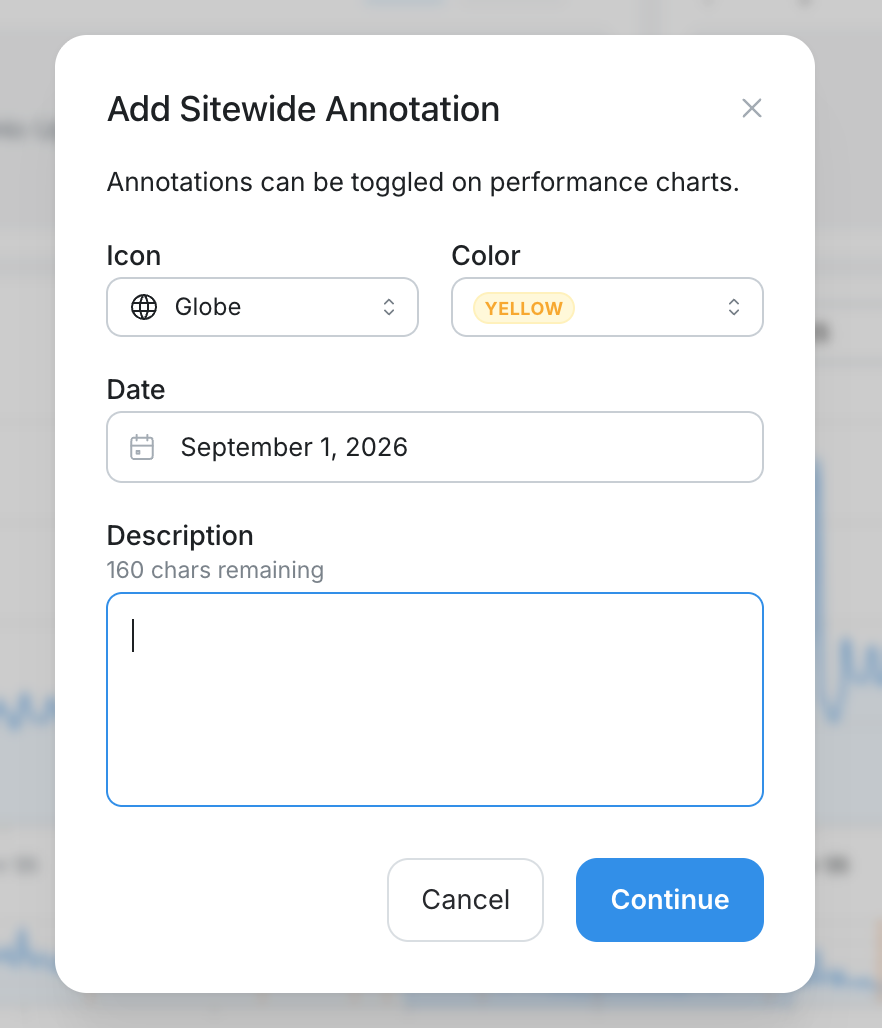
A sitewide annotation appears on your Home dashboard and every post’s performance chart. Add one by clicking any date on a chart, opening the annotations menu, or using a post’s Quick Actions. For changes that affect only one post, add a content annotation instead.
Google Core Updates, Already on Your Chart
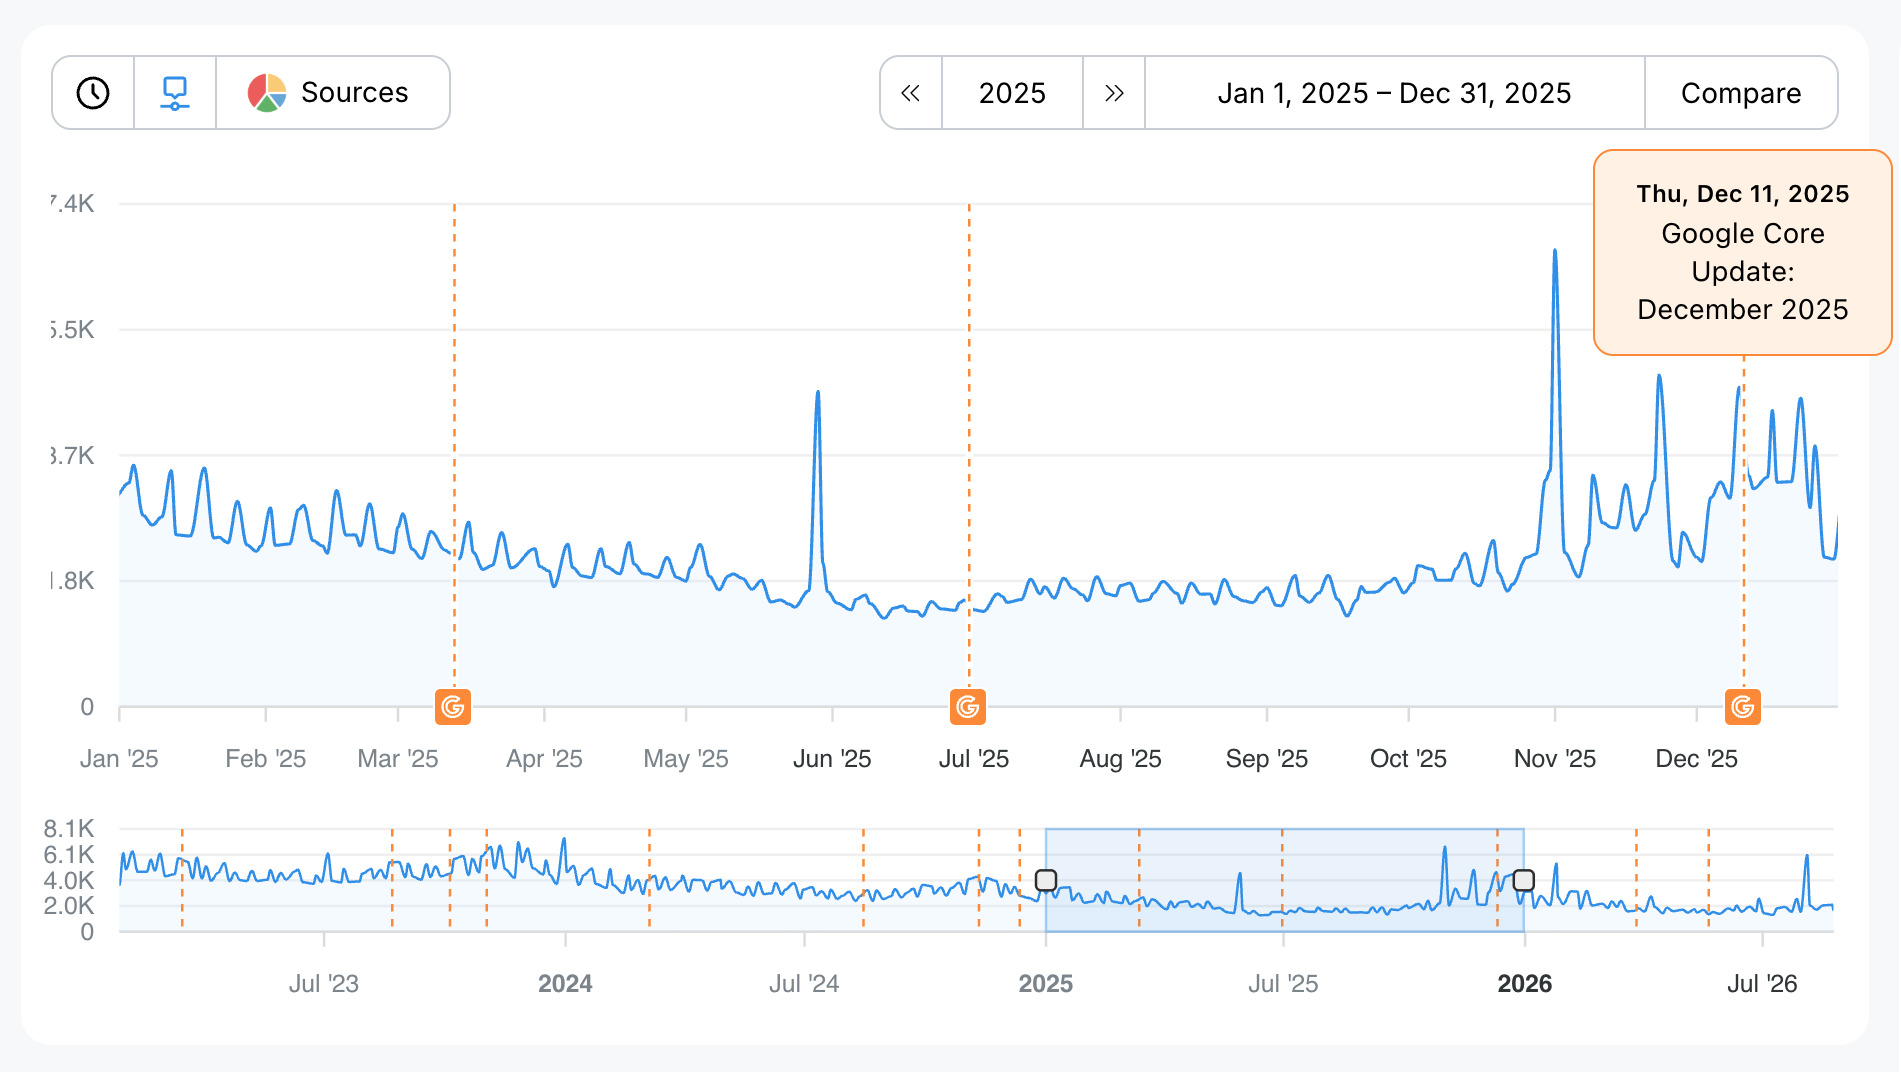
Official Google core updates appear automatically in orange with the Google icon, with no setup required. When traffic moves, you can quickly see whether an update rolled out around the same time.
Make Every Annotation Easy to Recognize
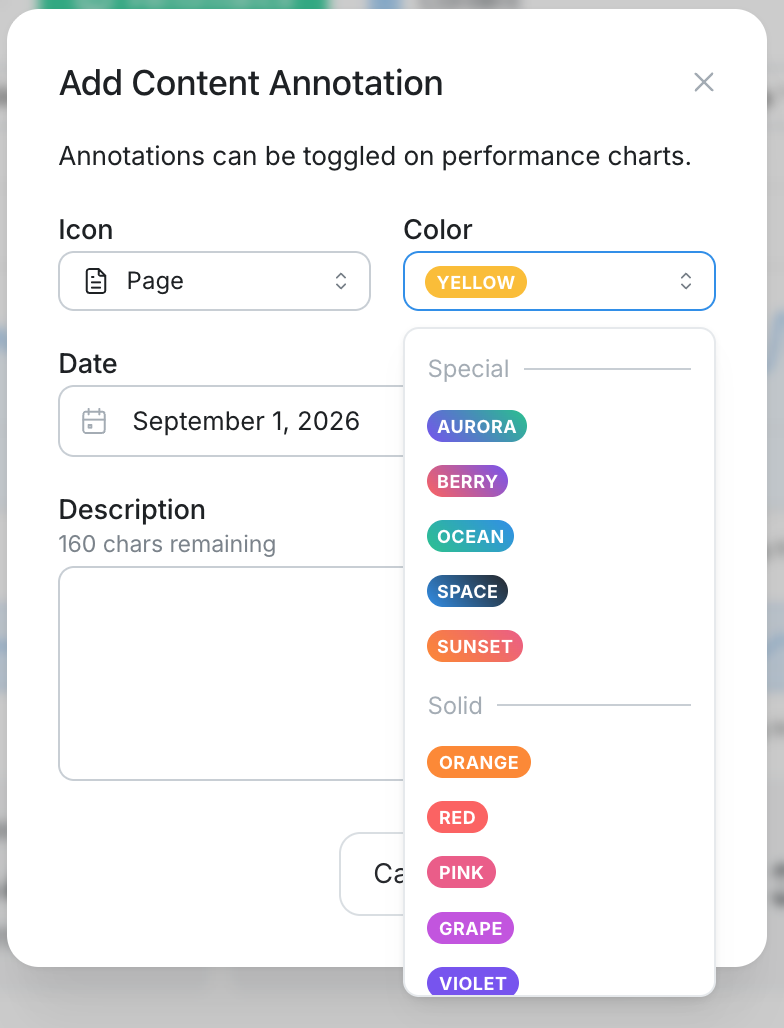
Choose a color and icon for each annotation so important events stand out. Use the annotations menu to show or hide Sitewide, Content, and Google Core annotations whenever you want a simpler view of the trend line.
Clariti Tip!
Create a simple color system before you start. Use one color for technical changes, one for content updates, and one for promotions. Over time, you’ll be able to scan your chart and understand your site’s history at a glance.